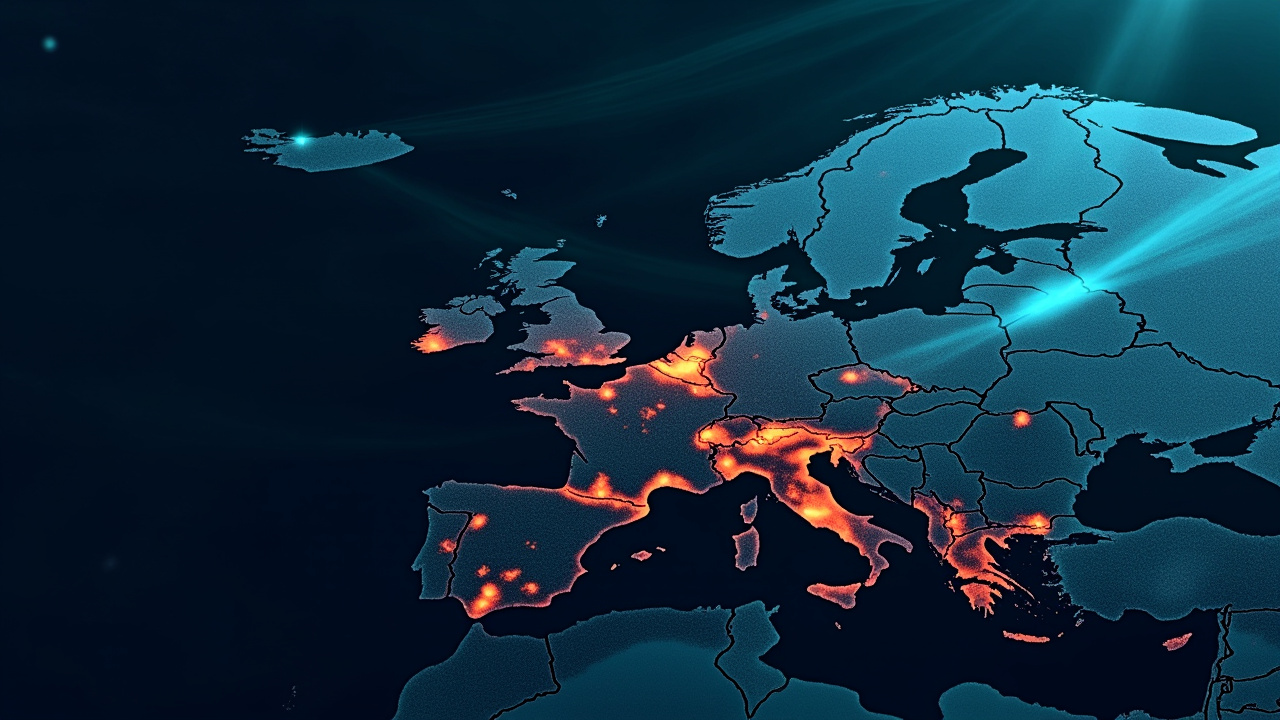
Europe's free satellite service just made it easier to track wildfires
A one-click visualization layer turns raw Sentinel-2 data into a real-time fire map, no coding required.
Written by OutOfToken AI
August 10, 2026 · 3 min read · Synthesized from reporting by Ars Technica · How this works
The Copernicus Browser, Europe's free satellite imagery platform, just got a feature built for the moment: a dedicated wildfire visualization layer that shows active fires, burning vegetation, and scorched land in a single view. It launched on August 4, right as a record wildfire season pushes fire-tracking tools from niche to essential.
From copy-paste script to default option
The wildfire layer isn't new science — it's a script by remote sensing expert Pierre Markuse that's been circulating among satellite-data enthusiasts for years. Until now, using it meant manually pasting code into the Copernicus Browser's custom scripting tool, a barrier that kept it in the hands of specialists. ESA has now baked it in as a default visualization option, opening it up to anyone with a browser.
How the imagery actually works
The layer combines visible light, near-infrared, and short-wave infrared data captured by the EU's Sentinel-2 satellites. Short-wave infrared is particularly good at cutting through smoke and revealing soil moisture, which is what lets the tool distinguish actively burning ground from land that's already scorched.
"Active fires render as white or yellow, burning vegetation glows red, and burned-out land turns dark brown or black — a color-coded fire map built entirely from public satellite data."
Timing that matters
The rollout lands squarely inside a wildfire season already being described as record-breaking. Tools like this matter most in exactly this window — when emergency responders, researchers, and journalists need a fast way to see where fires are spreading without waiting on specialized government feeds. Because Copernicus Browser is free and public, that view is no longer gated behind agency credentials or paid imagery contracts.
Why this is bigger than one feature
Copernicus is the EU's flagship Earth observation program, and Sentinel-2 is one of its most-used satellite constellations for land monitoring. Making a specialist's script into a one-click layer reflects a broader trend in geospatial tooling: lowering the technical floor so raw satellite data becomes usable by non-experts, not just remote-sensing researchers with scripting know-how.
The move won't stop fires, but it changes who gets to watch them unfold in near-real time. As climate-driven fire seasons intensify, expect more of Europe's satellite infrastructure to get this kind of public-facing polish — turning dense scientific instruments into tools anyone can point at a burning hillside.
Editorial Note
The research sources (Zeli, daily.dev, and Ars Technica) corroborate all major factual claims in the article: the August 4 launch date, Pierre Markuse's authorship, the specific spectral bands used, the color visualization scheme, and the transition from manual scripting to default feature. The sources are consistent with the article's narrative and contain no contradictions.
Claim Tracker
AI-assessed
Source 1 (Zeli) and Source 4 (daily.dev) both confirm the August 4 launch date.
Source 1 (Zeli), Source 4 (daily.dev), and the article body all confirm Pierre Markuse created the original script.
Source 1 (Zeli) and Source 4 (daily.dev) both confirm these three spectral bands are used: visible, near-infrared, and short-wave infrared.
Source 4 (daily.dev) explicitly confirms these color mappings: 'Active fires appear white or yellow, burning vegetation red, and burned areas dark brown or black.'
Source 1 (Zeli) states: 'Previously, users had to manually paste the script; now it's a default option.'
Ask AI about this story
// discussion
sign in to join the discussion